News

The OID work covered at the Brazilian G1

Rio de Janeiro, March 19th 2025


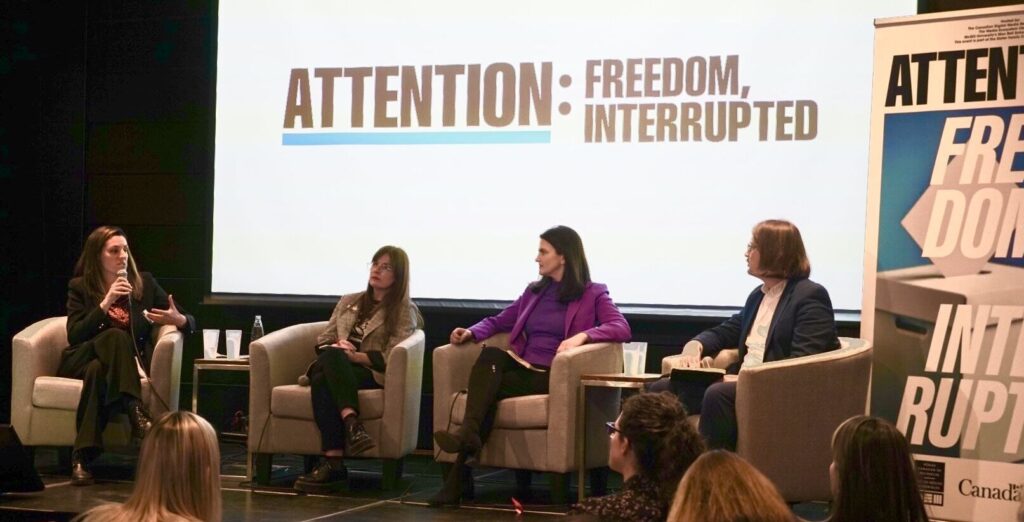
In the context of the Observatory on Information and Democracy dissemination event held at the Praia Vermelha campus of the Universidade Federal do Rio de Janeiro, we had the pleasure of discussing our report’s results with key stakeholders in the region. Our expert panel titled “Power Asymmetries in the Global Information Ecosystem and Their Significance for Brazil and Latin America” included: 

  • Marie Santini (Director of Netlab UFRJ and member of the expert committee of OI&D)
  • Luca Belli (Director of the Center for Technology and Society at FGV-Rio and member of the steering committee of OI&D)
  • João Brant (Secretary of Digital Policies at Secom, Federal Government)
  • Natalia Zuazo (UNESCO Digital Office for Latin America and the Caribbeans)

Following the conference, our report was featured in the Brazilian national evening news (G1). Watch the full coverage here: 

https://g1.globo.com/jornal-nacional/noticia/2025/03/19/observatorio-internacional-de-informacao-e-democracia-analisa-impactos-e-desafios-da-informacao-na-era-digital.ghtml?utm_source=whatsapp&utm_medium=share-bar-mobile&utm_campaign=materias 


News

Related articles

17 April 2025

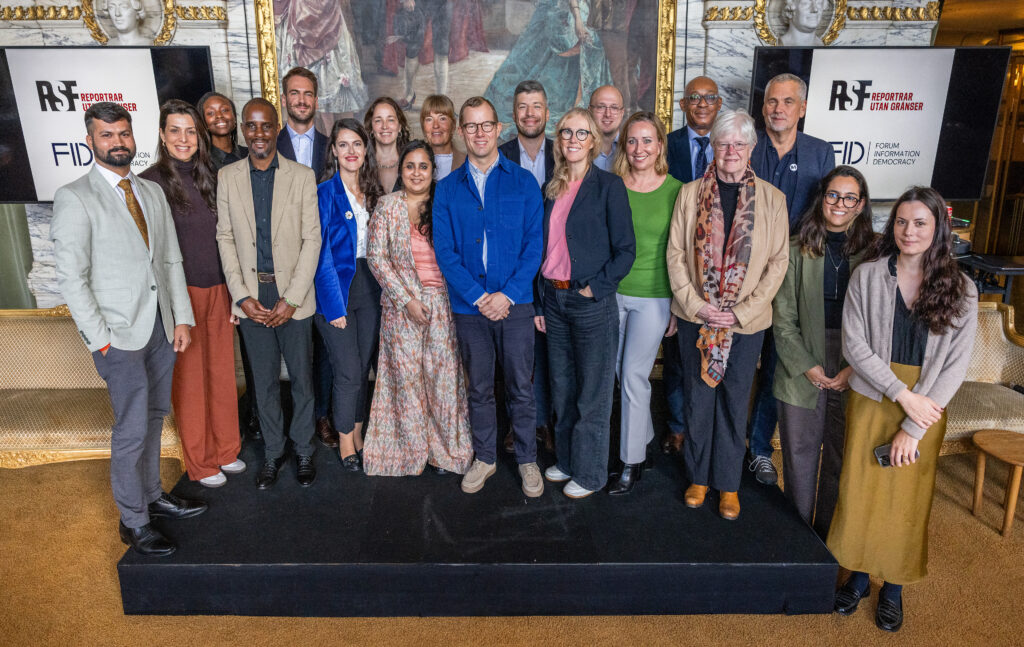
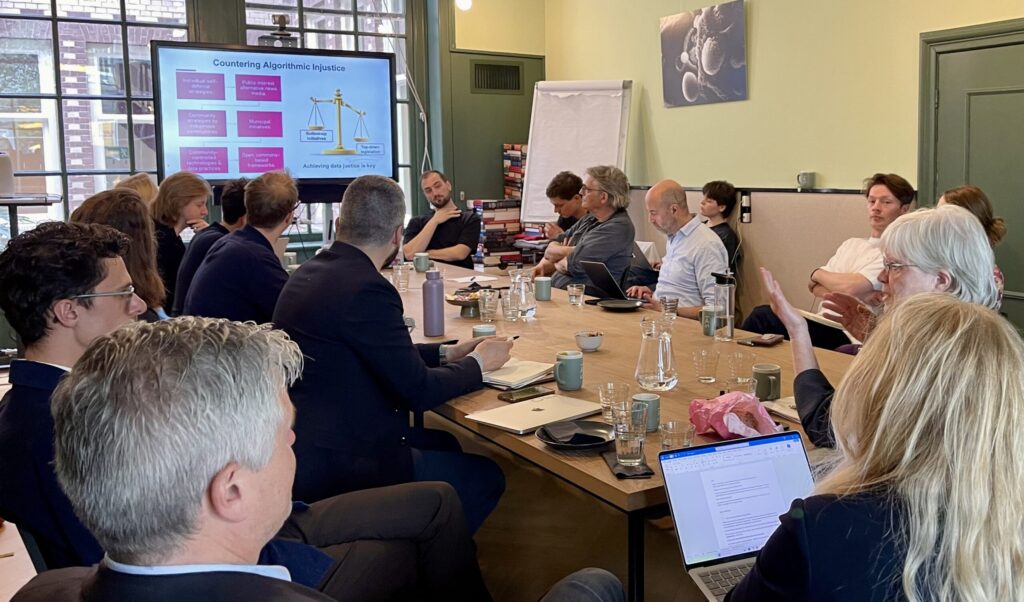
The OID in Amsterdam: Evaluating policy recommendations in the Dutch and EU context

24 March 2025

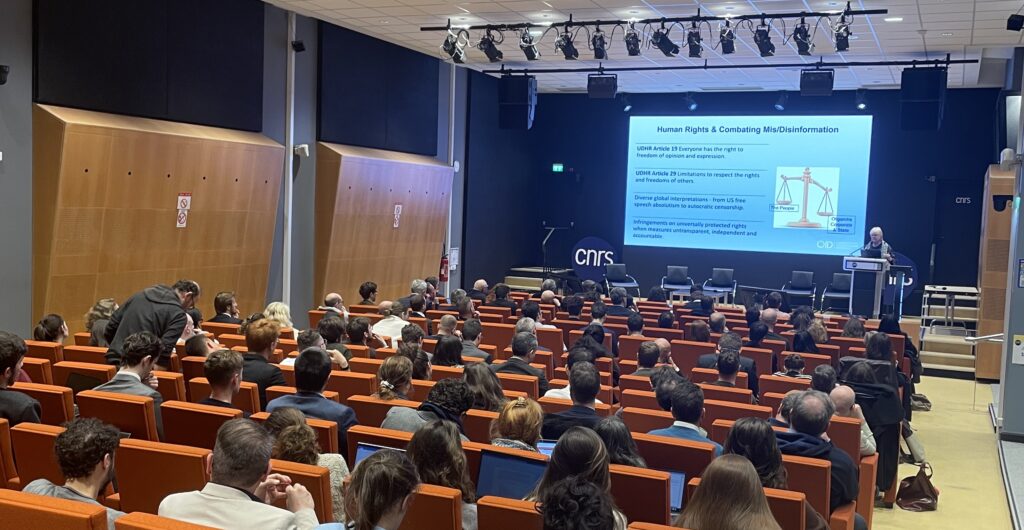
The OID “AI, Datafication, and Disinformation” event at CNRS Conference

20 March 2025

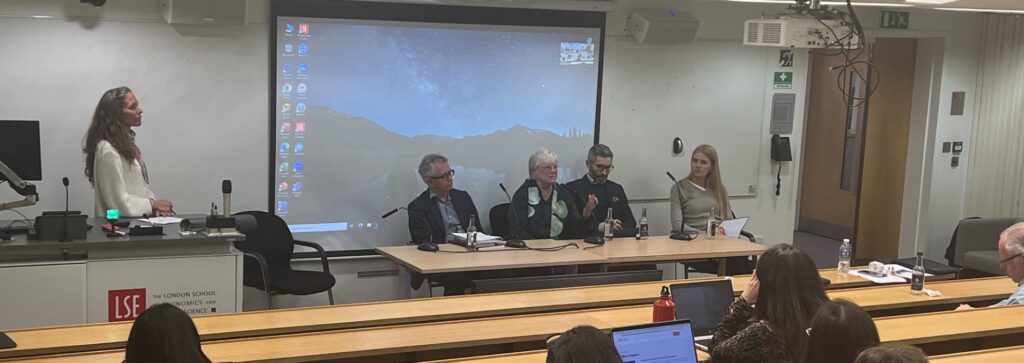
The OID in London (LSE): Navigating Information Integrity and Democracy in the Digital Age

15 March 2025

The OID was at the Prestigious “Attention: Freedom Interrupted” 2025 conference

11 March 2025

OID Scientific Director – We must tackle the “Western bias” of misinformation and disinformation research

21 February 2025

SNSPA Hosts Third Roadshow Event: A Deep Dive into Information Ecosystems and Troubled Democracy

The OID work covered at the Brazilian G1 – Interactive Map

Developed in partnership with CNRS Institute for Complex Systems.

This map represents a statistical summary of the thematic content of the report. The network graph represents relations between the words in the report, placing them closer to each other the more they are related. The bigger the node, the more present the word is, signalling its role in defining what the report or chapter is about. The colors represent words that are closely related to each other and can be interpreted as a topic.

The map was generated by Giovanni Maggi using the GarganText tool – developed by the CNRS Institute of Complex Systems – on the basis of the repot’s text.