The OID “AI, Datafication, and Disinformation” event at CNRS Conference

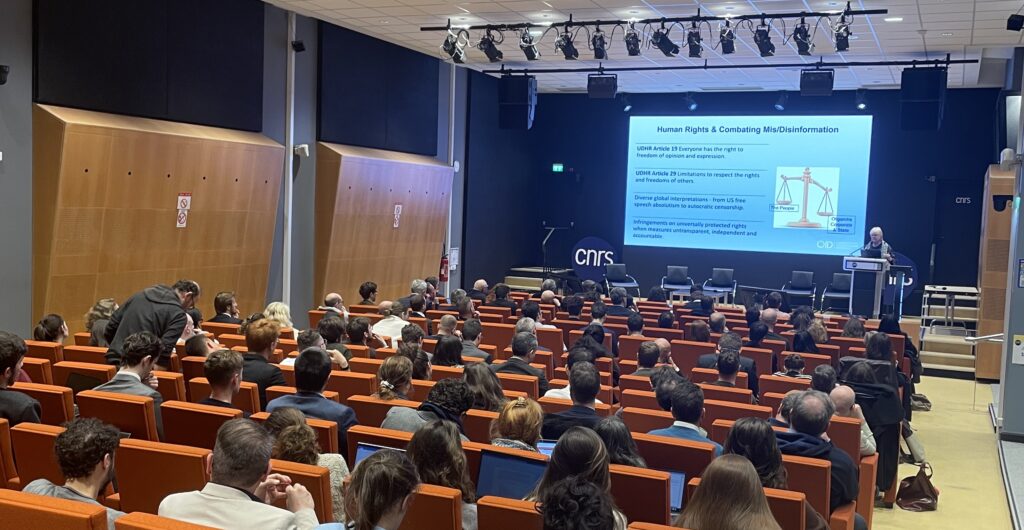
On March 24, 2025, the Observatory on Information and Democracy  the Observatory organised an event on “AI, Datafication, and Disinformation” as part of CNRS’s conference on trust ecosystems held at the CNRS headquarters in Paris. This event, structured into two complementary sessions, provided an opportunity to explore perspectives on combating information manipulation and the impact […]

The OID “AI, Datafication, and Disinformation” event at CNRS Conference – Interactive Map

Developed in partnership with CNRS Institute for Complex Systems.

This map represents a statistical summary of the thematic content of the report. The network graph represents relations between the words in the report, placing them closer to each other the more they are related. The bigger the node, the more present the word is, signalling its role in defining what the report or chapter is about. The colors represent words that are closely related to each other and can be interpreted as a topic.

The map was generated by Giovanni Maggi using the GarganText tool – developed by the CNRS Institute of Complex Systems – on the basis of the repot’s text.